
The most successful cannabis retailers are the ones who make data-informed decisions.
That's why we’re excited to introduce the Executive Summary Dashboard — the new data visualization feature in Flowhub Maui designed to help multi-location dispensaries effectively track and analyze performance across all stores.
The Executive Summary Dashboard provides cannabis retail executives and management teams with Key Performance Indicators (KPIs) at a glance. With the ability to see real-time trends and compare data across store locations over time, you’ll better understand sales patterns and gain the business intelligence to maximize, personalize, and localize customer experiences.
Make dispensary business decisions faster
The Executive Summary Dashboard provides cannabis retailers with immediate business insights. Because the dashboard lives within the Flowhub Maui application, it’s readily accessible.
Plus, the dashboard doesn’t require you to download your data or run it through an external system (but you can still do that if you’d like). There are no extra clicks or middle steps needed to see how your business is performing.
You can even hover over any chart or graph with your mouse and see detailed information across every dataset — no clicking necessary!
Not only does this dashboard make daily reporting more visually appealing with real-time graphs, it’s also far easier to consume and analyze that data in a single glance.
For dispensary owners and executives with busy schedules, this instant transparency into overall performance across dispensary locations is crucial. There’s no time wasted, so you can quickly find the data point you’re looking for and respond in a timely manner.
Visualize your most important data points
The Executive Summary Dashboard gives cannabis retailers an instant view into real-time business performance. With an enhanced visual design, it’s easier than ever to check the pulse of your stores, either aggregated or specified by location.
Below are the key data points you can track and view in the Executive Summary Dashboard.
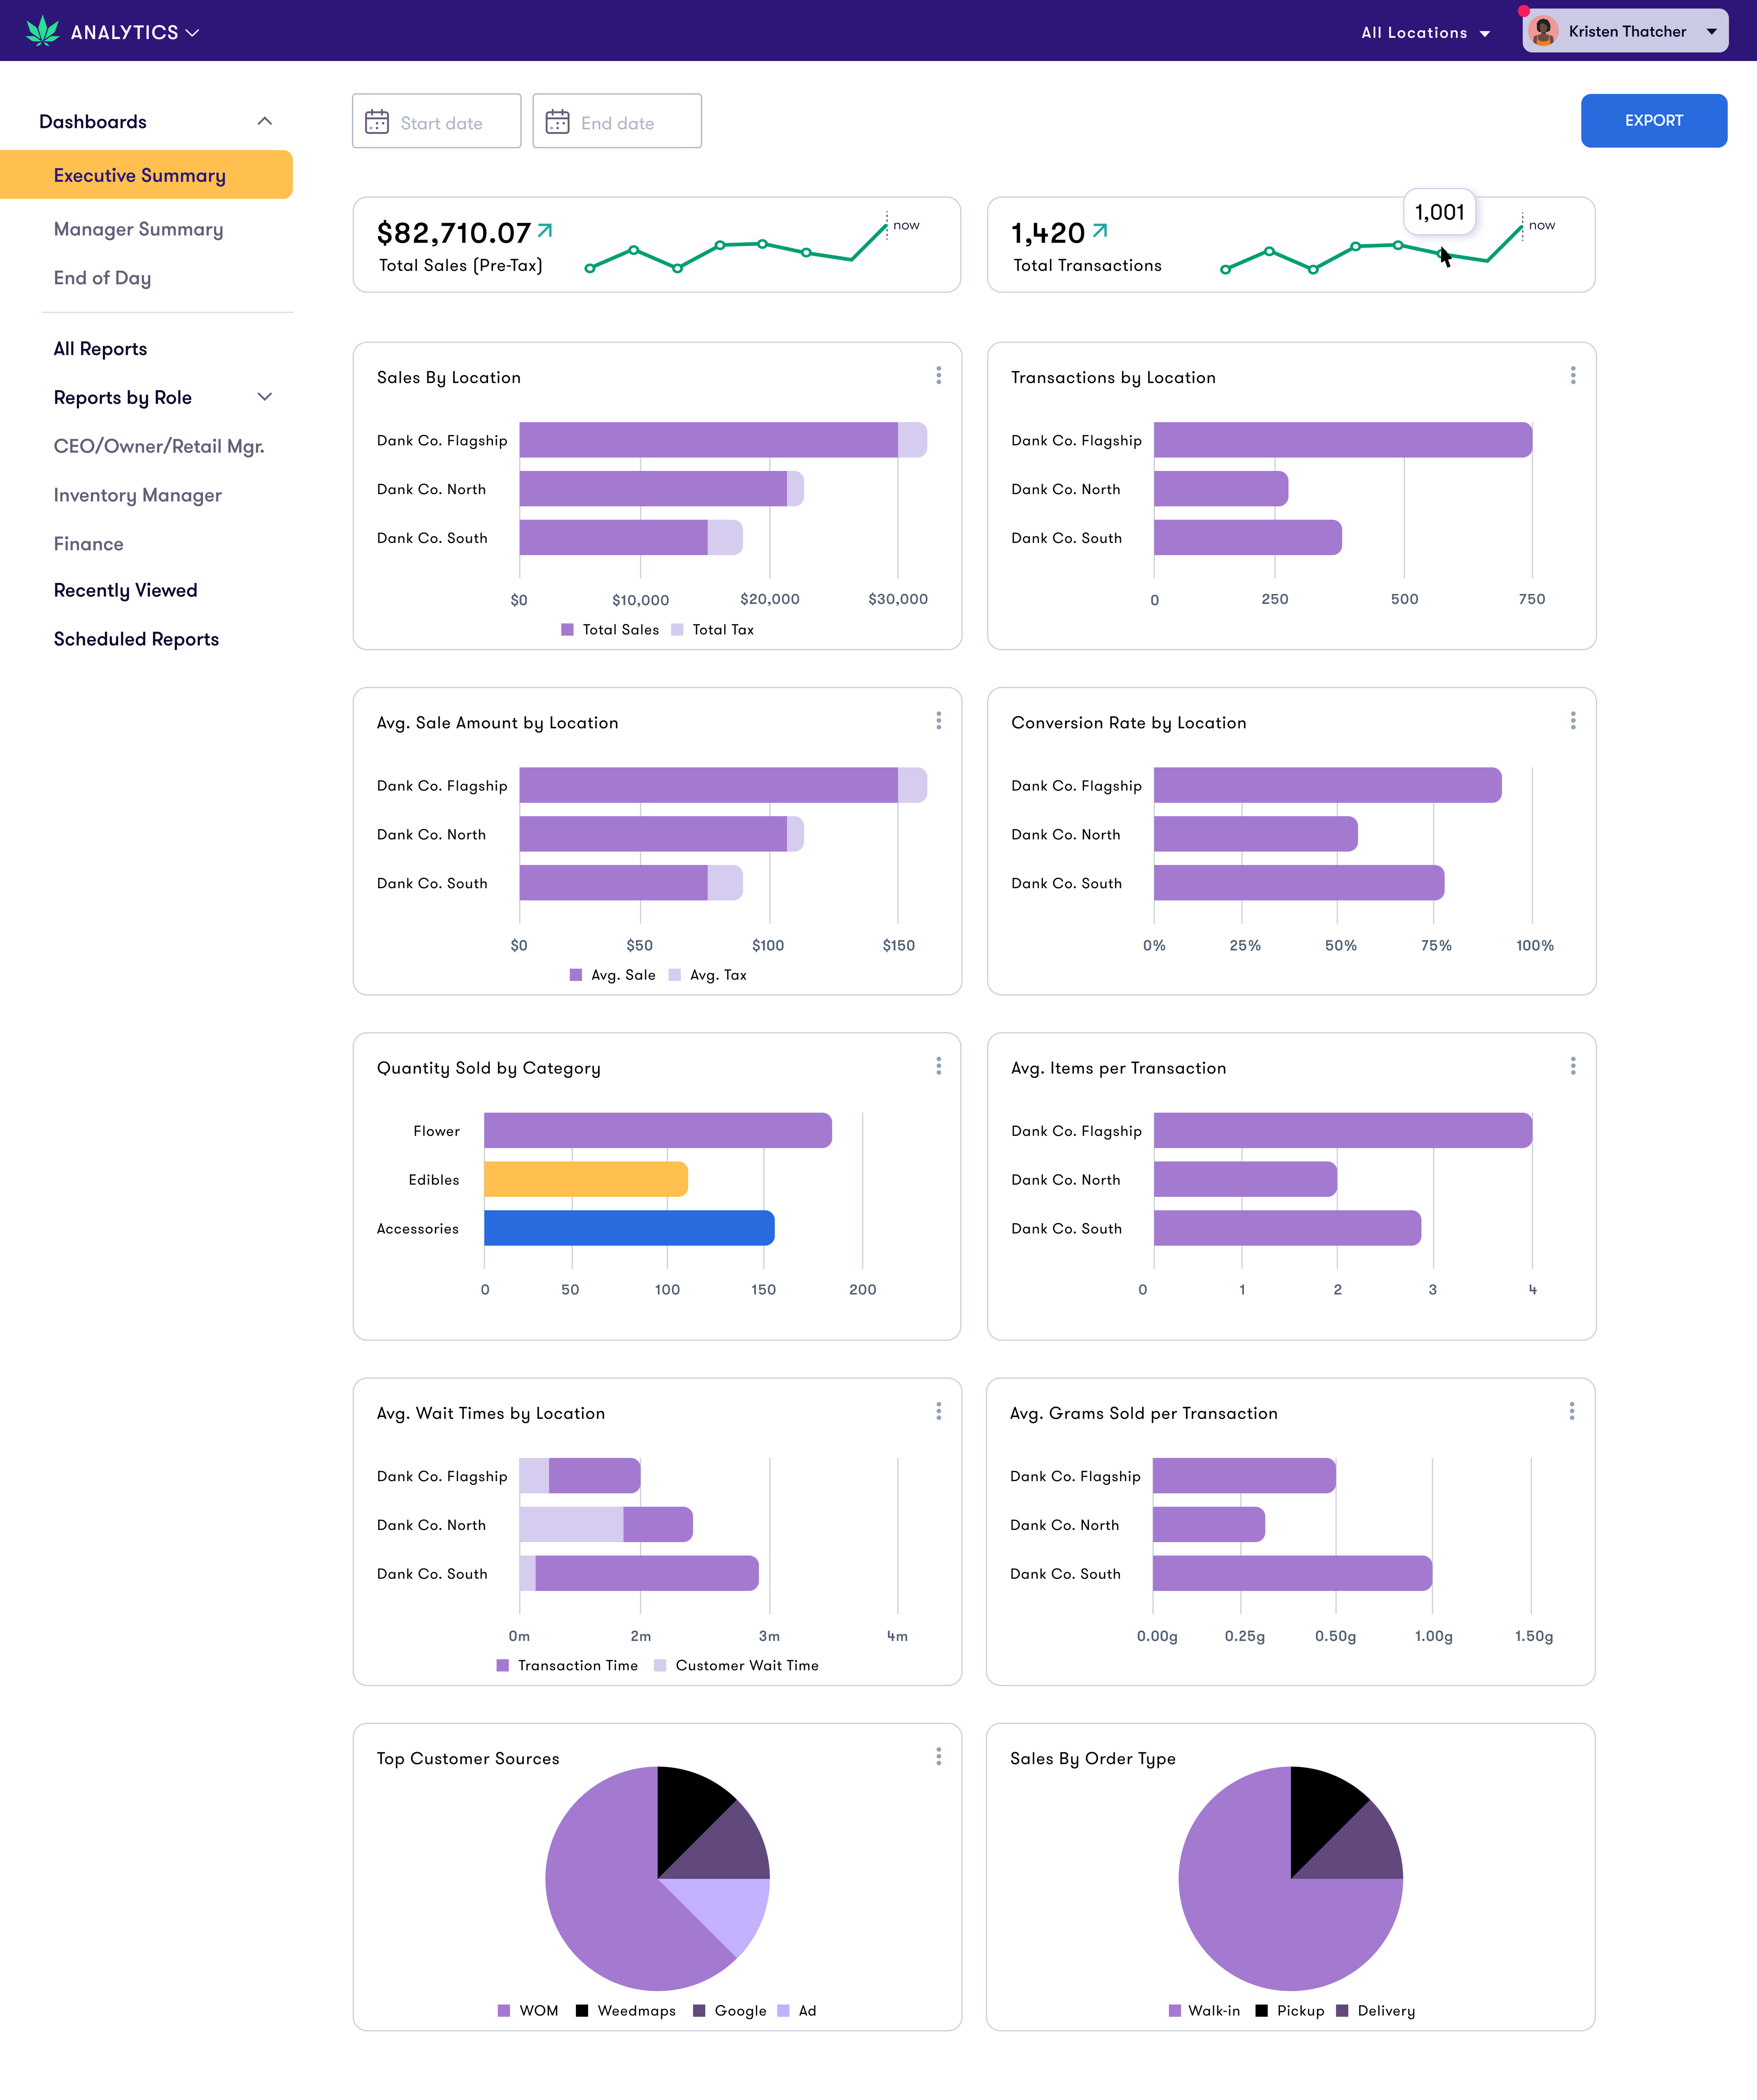
Total Sales (pre-tax)
The sum of all pre-tax sales revenue over the entire duration of a selected date range. The amounts are broken down by location and into relevant intervals given your selected date range.
Answer questions like:
Which stores drive the most revenue for your business?
Are there specific days of the week that consistently drive more sales?
Does it make sense to start running a promotion or special discount on slower days to boost revenue?
Total Transactions
The sum of all transactions that occurred within a selected date range visualized with a trend line.
Answer questions like:
Is my business seeing increased foot traffic recently?
What days of the week are the busiest at my dispensary?
Transactions by Store
A count of all transactions completed at each of your stores.
Answer questions like:
Is one store impacting sales positively or negatively compared to others?
How are new products or promotions impacting traffic at certain locations?
Do the highest transaction stores also drive the most profits?
Average Sale Amount by Store
The average amount spent by customers at each dispensary location.
Answer questions like:
Which stores have the highest and lowest average sale amount?
Is there a difference between stores in metropolitan vs rural areas?
Are promotions and discounts being misused?
Quantity Sold By Category
The number of items sold by category, like “flower”, “edibles”, and “accessories”. This data can help you forecast sales and make inventory purchasing decisions based on customer demand, as well as see how consumer buying habits are different across locations
Answer questions like:
What products are most and least popular?
What are the purchasing trends at each dispensary location?
Which deals are utilized most frequently?
Average Items per Transaction
The average number of units sold per transaction.
Answer questions like:
How well are staff cross-selling/up-selling on the dispensary floor?
Are we making it easy to bundle multiple products for more transactional shoppers?
How can we adjust store displays to encourage higher order volumes?
Average Wait Times By Store
Broken down by wait time (before the customer is selected from the queue) and transaction time (duration from when they are selected from the queue and when the transaction is completed).
Answer questions like:
Do longer wait times affect average sale amounts?
How long are customers waiting between check in and check out?
How long do transactions take at each location?
Is one store more efficient compared to another?
How can you improve the time it takes to move customers through your queue?
Top Customer Sources
A pie chart of customer sources entered when creating customers during the date range selected.
Answer questions like:
Where are your customers learning about your business? Word of mouth? Leafly? Instagram?
Are you seeing a return on investment (ROI) from your marketing efforts?
Sales By Order Type
A pie chart of the types of sales made during a selected date range selected. The order type options are walk-in, delivery, and pickup.
Answer questions like:
Are delivery and order ahead workflows worth investing additional effort in order to maximize ROI?
Are weekends busier with in-store traffic while weekdays experience increased online orders?
This is just the start! We are constantly adding new data points based on customer feedback and needs.
Visual analytics lead to better business insights
Improved data accessibility in the Executive Summary Dashboard means cannabis retailers can make business decisions faster and also act with confidence and accuracy.
This feature is essential for multi-location cannabis retailers looking to analyze performance data across stores. By visualizing your data, you can extract the real-time insights necessary to develop scalable business strategies.
The strategies you create based on data will have a lasting impact on the health of your business, so it's important to trust the data driving those decisions. The transparency and accuracy of the Executive Summary Dashboard provides the peace of mind that retailers can trust what they see.
If you’re ready to learn more about Flowhub Maui’s in-app Executive Summary Dashboard, schedule a demo to see the data visualization in action.


