12 Cannabis Dispensary KPIs You Should Track

Do you know how well your cannabis business is performing?
In this resource, you'll learn the top KPIs cannabis dispensaries should be tracking, why you should be tracking them, and what to do with the data.
KPIs (or key performance indicators) are the data points or metrics you watch to make sure your business is successful.
Knowing what to watch, and then how to take action on that information, is the hardest part. Luckily, many cannabis point of sale (POS) systems track and organize metrics for dispensaries automatically, so you already have the information you need.
Let’s dive into the specific KPIs you should be tracking at your dispensary.
Cannabis dispensary profit KPIs
Average cart size and value
Average cart size tells you how many items (or units) the average transactions includes. Average transaction value (ATV) is the average dollar value of this cart.
For example, it's helpful to know that your average transaction includes 2.3 items and is valued at $45.95.
Knowing these two averages shows your benchmark, and helps you evaluate your cannabis dispensary's:
- Sales team performance (cart size by budtender)
- Upsell opportunities
- Customer buying habits
- Ideal price points
- Store layout
- Cart size by location (if applicable)
In general, increasing the number of items purchased, or the value of those items, will increase profits. Using BOGO discounts could help increase your items per transaction.
Time per transaction
This cannabis dispensary KPI is exceptionally important because it has a direct impact on customer experience, which has a direct impact on sales.
Tracking time per transaction can help you identify any hiccups in the sales process or your store workflows. If time per transaction gets to be too long, your dispensary may experience long lines which can frustrate customers and cause them to leave before making a purchase, or never return to your shop.
Time per transaction can also help you determine staffing. If your transaction times are too long, it may be time to schedule more people so they can work through the customers that are waiting in line. If you have more than one store, compare times to identify areas for improvement.
Some common issues that can lead to longer times per transaction are:
Inefficient or buggy POS software
Untrained staff
Products without proper labels
Not enough inventory on the floor
Not enough budtenders available to help customers
Not enough square feet in your store
Opting for deli-style vs. pre-packed flower
One important piece of the total time per transaction is wait time. This is how long it takes customers to get helped by bud tenders after they check in. Managing this time will help create a positive customer experience.
Discount use and type
When it comes to your dispensary’s bottom line, knowing the type and usage of discounts is crucial. Ideally only a fraction of your transactions are discounted. Data shows that 18% of dispensary transactions include a discount.
To determine what a healthy percentage of transactions with a discount for your dispensary would be, make sure you’ve set an acceptable range of gross margin for your products so you know you’re still making a profit.
There are a few different types of discounts you can track:
- In-line discounts applied by the budtender
- Auto-applied discounts built by store managers
- Coupon codes applied at checkout using pre-set codes

Your dispensary POS system should be able to track this KPI for you. Look not only for a breakdown on types of deals, but by budtender. Flowhub dashboards show percent of sales discounted by budtender and types of specials by budtender to get more granular and look for inconsistencies or overuse of discounts.
You can also use these metrics to determine which of your specials are redeemed most, helping you to create effective specials. You don’t need a bunch of deals, you just need a few effective deals.
New vs. returning dispensary customers
Knowing how many of your daily customers are new versus returning helps you evaluate everything from staffing decisions to your marketing promotions.
If most of your customers are new, you’ll want to figure out why you’re not retaining customer loyalty. Some key factors include:
Staff helpfulness and friendliness
Product pricing
Average wait time
Variety and availability of cannabis products
Overall brand perception
If most of your customers are returning, you may want to focus on bringing in more new customers. Some ideas to do so include:
Running first-time-customer specials
Offering rewards for your returning customers who refer new customers
Expanding your sales capabilities by implementing online ordering, delivery, and/or curbside pickup
Optimizing your local digital marketing and social media efforts

Customer demographics
The more you can see about your customers, the better you can serve them. Even basic information, like gender and age, can help you make decisions around products, store layout, and how/where you promote your cannabis operation.
Knowing who your customers are makes it easier to retain them. Plus, knowing what type of person you naturally attract can help you more deliberately attract more customers like them.
Another factor here is customer sources. If you’re tracking where customers come from, you can gain insight into which channels are most or least effective (or what the return on investment is). Common customer sources include word-of-mouth, Instagram, billboard, foot traffic, event, etc.
Read Next!
Guide to Cannabis Consumers by State
Number of transactions per customer
Learning how many transactions each of your customers make will help you determine the lifetime value of each one. You can track this weekly, monthly, quarterly, and/or annually. This knowledge is particularly helpful if you also track how much it costs to earn a new customer.
By monitoring your initial spend to gain a customer, then how many transactions they’ve completed in your dispensary over the following month, you can better understand their overall value for your dispensary. Plus, you can better tailor your dispensary’s promotions and upselling strategies.
For example, if you have a cohort of customers that average 2 transactions per month, consider setting a goal to get them to 5 transactions per month through targeted marketing promotions.
Note: Oregon has strict data sharing policies. You may have a harder time accessing customer data if they do not opt into sharing this information.
Cannabis dispensary inventory KPIs
Sales by category
Sales by category gives you direct insight into what people buy. It also guides how you should be stocking your inventory. You can break it down by consumption method, type of strain, cannabinoid content, terpene content, etc.

Here are a few categories and subcategories to consider tracking:
Consumption methods
- Flower
- Edibles
- Concentrates
- Vapes
- Topicals
- Accessories
Strain type
- Indica
- Hybrid
- Sativa
- CBD
Knowing how well or how poorly a specific category is selling will let you know if you should be stocking more or less of that type of product so you can customize your inventory to your specific customers’ needs and wants.
Par levels
A par level is the minimum level of inventory necessary to ensure it’s always in stock. If an inventory item falls below par level, that item needs to be reordered immediately.
This metric is important to forecast stocking of inventory. Your par level report looks at the number of units sold compared to how many you initially had on hand at the beginning of a period.
Having solid par levels (and par level reporting) helps you know when it’s time to order so you never run out, but also looks at historical sales to ensure you don’t over-buy your inventory. This allows you to increase efficiency, cut costs, and decrease spoilage.

Vendor tracking
Keeping track of your vendors involves a few KPIs, all of which your dispensary POS system should be able to monitor. These include:
How fast is each vendor’s product selling? You can compare this with sales by category to see how much of their product makes up a category’s sales.
How often do you have to reorder from each vendor? This can help you determine if you need to be buying more per order so you don’t have to spend as much time placing orders and waiting for delivery.
Which vendors produce the best margins? Obviously, the better the margin, the more of that particular vendor’s products you’ll want to try to sell.
Which vendors are top sellers? This bigger picture vendor view helps you understand which products are making you the most money, but also which brands your customers are loyal to.
Cannabis dispensary location KPIs
Traffic flow metrics
Knowing your dispensary’s peak hours, days, and times of year affects nearly every other cannabis dispensary metric, including inventory, scheduling, promotions, and store hours.
Your dispensary POS system should have the ability to publish reports that show your busiest times of the day, of the week, and of the year so you can monitor and adjust your other KPIs accordingly and compare your year-over-year growth.
Busier times require more staff so time per transaction doesn’t get too long. If you have busy times where you make enough money, consider staffing more budtenders to keep transaction times down and customers happy.

Top budtenders
Tracking individual budtender sales in your POS system will help you determine your top budtenders.
This is another metric to keep in mind when scheduling your staff. Those who have a higher number of transactions, number of items per transaction, and/or higher sales per transaction should be the ones scheduled during your busier hours of the day.
Watching budtender performance can also help when it comes time for promotions and raises. Consider offering contests around budtender metrics to increase their numbers.
On the flip side, watching these metrics can also illuminate areas of concern, such as low-performing budtenders who may need more support or training, and issues of fraud or theft.
Total sales
This is an obvious one. You need to know your total sales so you can know if your marijuana dispensary is profitable, if you need to stock more inventory, if you need to advertise more, and if you need to schedule more staff.
To get a holistic view, make sure you’re watching:
Total sales by month
Total sales by location (if applicable)
Total sales year-to-date (YTD)

Related to sales (as in dollars), you should be watching the number of transactions by month and location. Your sales or revenues are made up of the number of transactions x ATV, so it’s best to have a clear picture of these three data points and how they impact each other.
If you have more than one location, watch sales data to compare both within the stores, and across them. This can give you insight into what strategies you should be emulating across locations as well as how your customer bases differ so you can alter any promotions or techniques accordingly.
Your dispensary POS system can help you monitor your stores’ progress so you can implement promotions or different sales strategies to reach your goals.
Finding your data in Flowhub
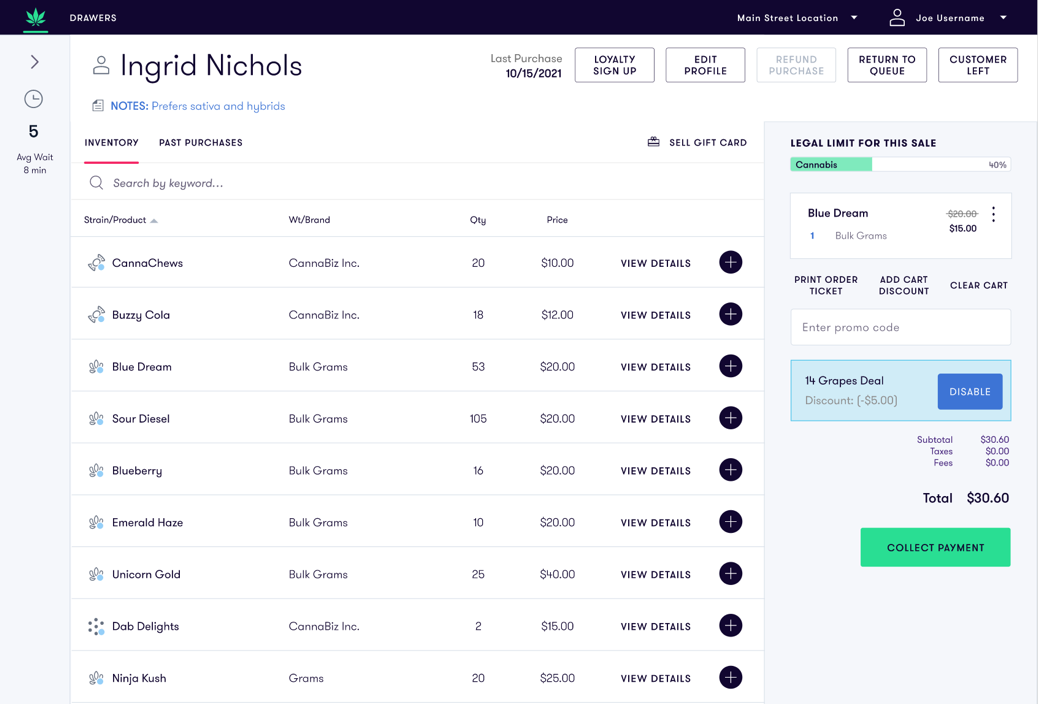
We know there are a lot of KPIs to keep up with in the cannabis industry, but fortunately, most of them appear automatically in Flowhub Dashboards and in the mobile app, View™. You can also build customer reports to slice-and-dice your data in any way you need.

Here are a few additional resources to help you make the most use of your Flowhub data:
About Store Dashboards
About Executive Dashboards