Data is critical for any cannabis dispensary looking to identify revenue opportunities and make intelligent business decisions.
Because regulatory agencies require detailed track and trace reporting for compliance, cannabis retailers have more data at their fingertips than ever before. Despite this increased access to data, many still struggle to make any sense of it.
To help cannabis executives and management teams extract valuable insights from their data, we recently introduced Executive Dashboards which allows multi-location dispensaries to compare performance trends across all store locations.
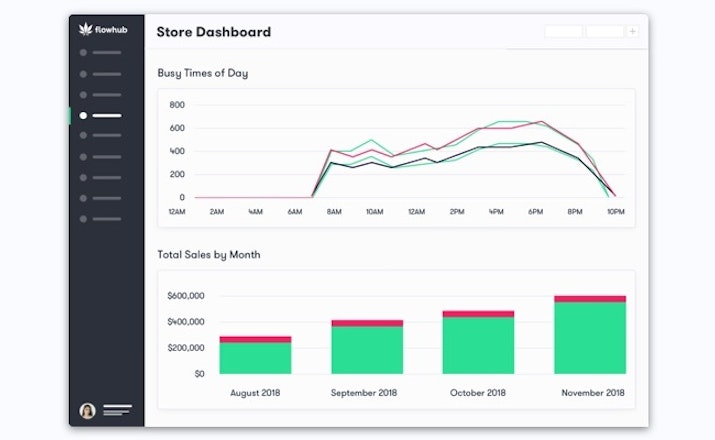
Now we’re excited to announce Store Dashboards—a new reporting feature for visualizing store-level trends and Key Performance Indicators (KPIs) in real time.
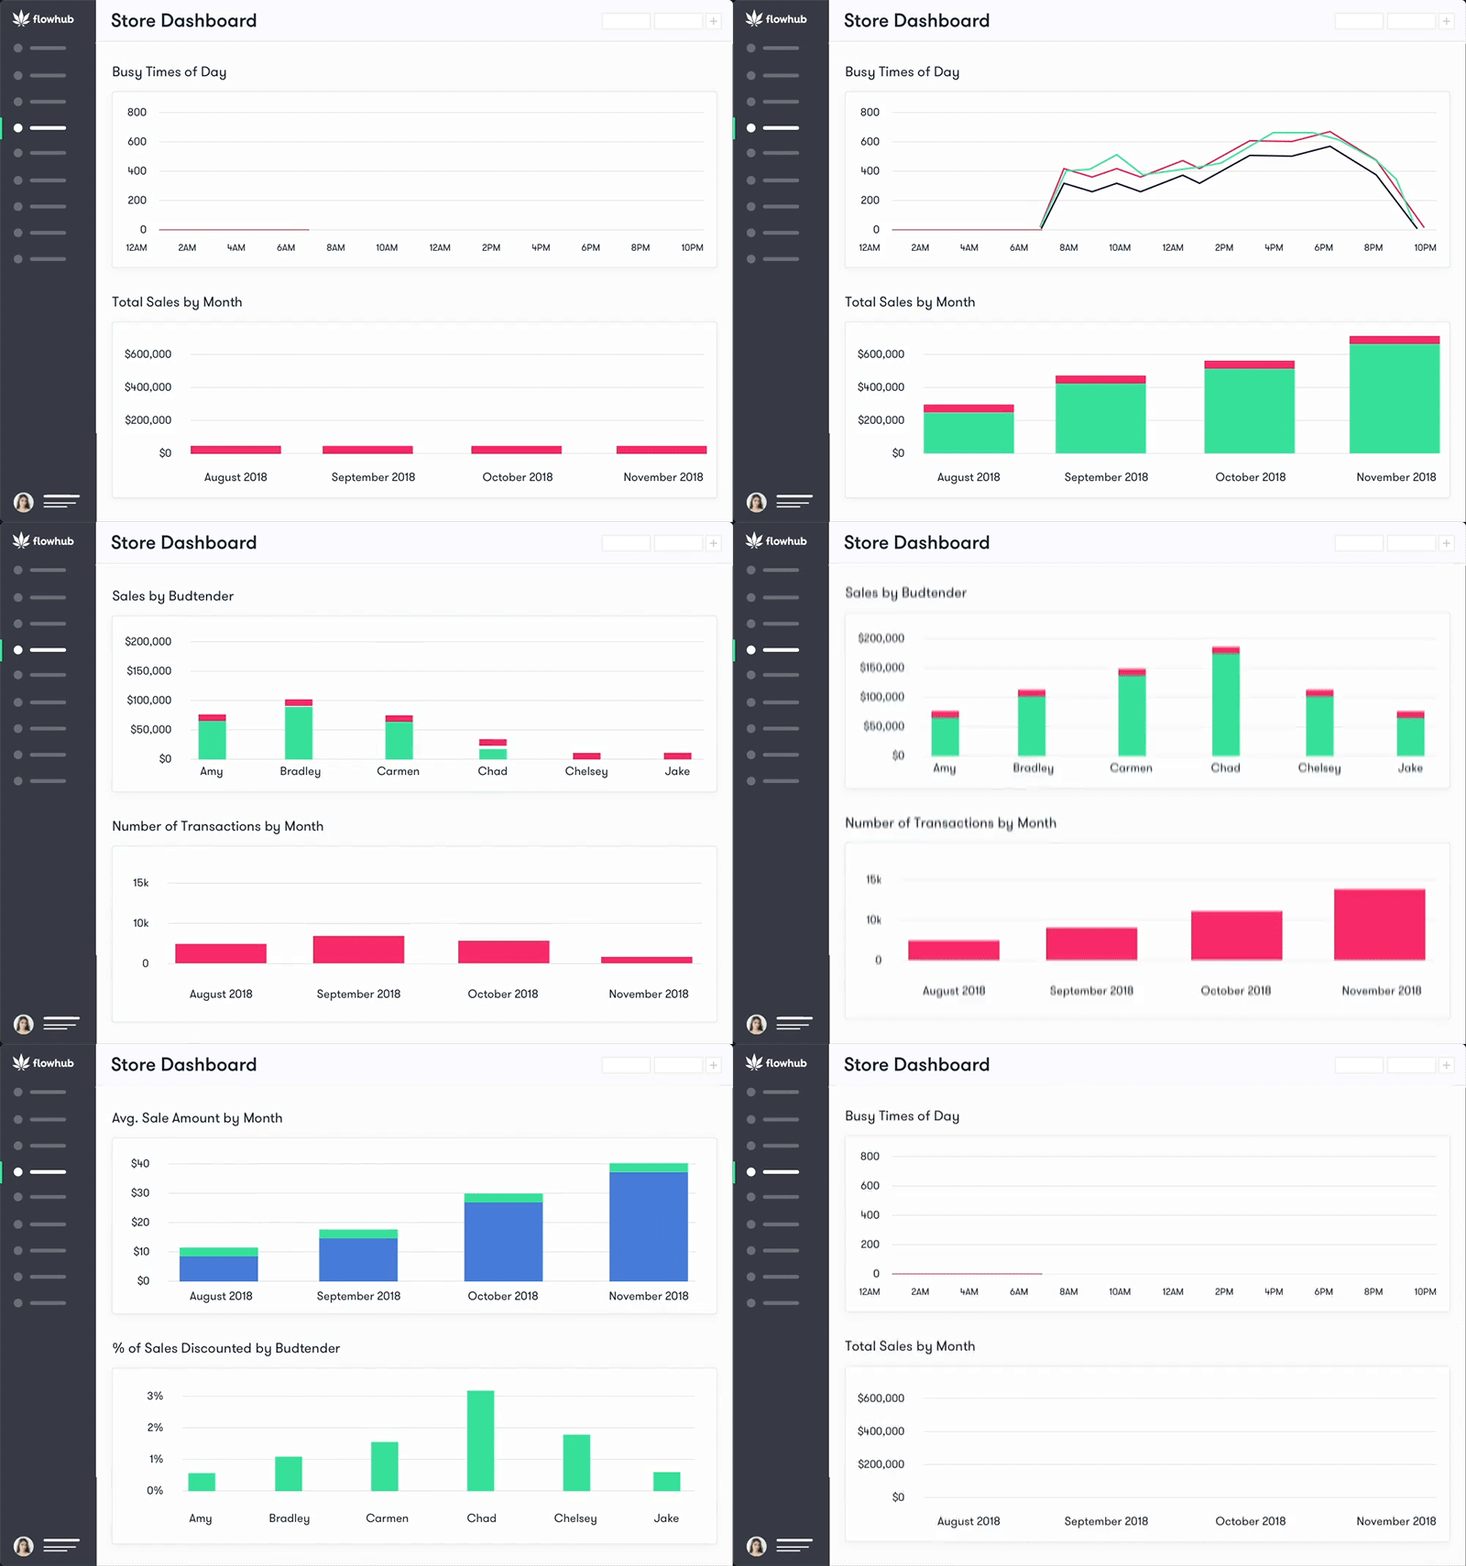
The Store Dashboard is designed for managers to easily access the most vital information necessary to get a high-level view of dispensary performance, identify top-performing employees, and determine areas for improvement.
What’s included in the Store Dashboard?
The Store Dashboard includes the below graphs:
- Busy Times of Day
- Total Sales by Month
- Sales by Budtender
- Number of Transactions by Month
- Number of Transactions by Budtender
- Average Sale Amount by Month
- Average Sale Amount by Budtender
- % of Sales Discounted by Budtender
- Types of Deals/Specials by Budtender
- Customer Sources
Using these real-time KPIs, managers can quickly determine if business is going in the right direction. Besides providing visibility into your data and an easy way to track your success, the Store Dashboard benefits your dispensary by allowing you to:
Optimize shift schedules: Adjust staffing requirements and break schedules to accommodate busy or slow times of day.
Increase profitability: Assess how you are performing in comparison to your revenue projections and take immediate action to course correct. Are slowdowns or big spikes seasonal? Is your recent growth based on a recent event, new products, or specific marketing channel?
Boost staff performance: Motivate budtenders to hit quotas by giving them insight into total sales, number of transactions, average sale amount, and discounts in comparison to their peers.
Track discounts: Understand how discounts are being applied with drill-downs into the different types used: in-line vs. auto-applied vs. coupon codes.
Measure marketing ROI: Identify how customers are finding your dispensary. If you’re not collecting this source data, it may be a good practice to start so you can identify which marketing channels are driving new and repeat customers through the door.

Share compelling data: Improve internal and external communication about how your company is performing. The Store Dashboard can help you visually communicate your success not only to your team, but also to potential investors.
Save time: Gone are the days of pulling Excel spreadsheets with endless rows of data points to find answers to common questions. Now all your key metrics are available at a glance in one place.
How it works in Flowhub
In order to view the Store Dashboard, you must have the “Store Dashboard” user permission. This new permission can be granted by any user with existing “Manage Employees” permissions.
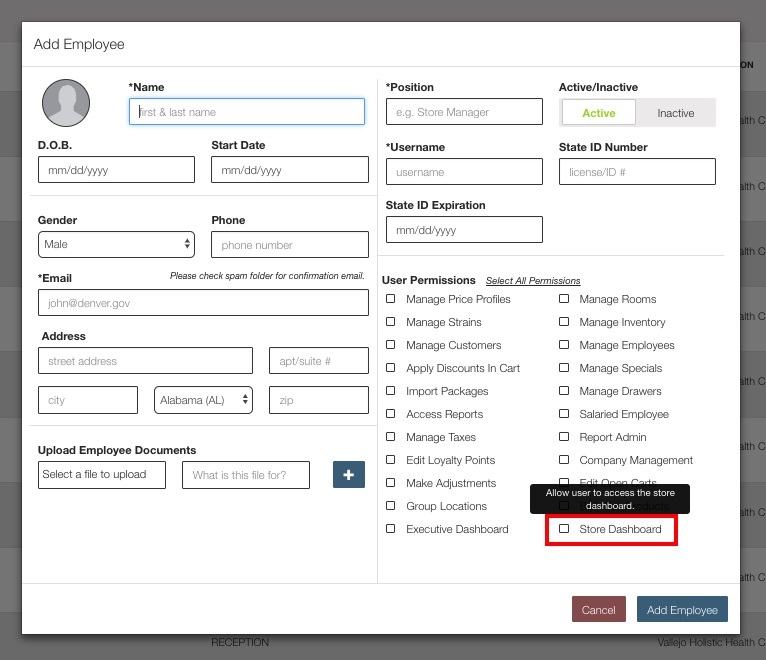
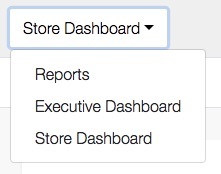
Once you have access, you’ll see the Store Dashboard populate on the Reports New tab.
Since all your historical data will be available for analysis, we encourage you to look back at your 2018 data and review your store performance.
Where you can improve in the new year? Which months were best for sales? Did you experience any unexpected dips? Which staff members can you reward for consistent high performance?
To view graphs for a desired timeframe, you can easily adjust the Date Range by editing the “Start Time” and “End Time”. By default, graphs will show data from the previous 90 days. Once you select your Date Range, click “Update Charts”.

What will you discover with the Store Dashboard?
The Store Dashboard is a powerful tool for understanding key performance metrics at a specific dispensary location. By presenting complicated data in a visual, digestible format, you can focus your energy on optimizing for growth (and spend less time crunching the numbers manually).
If you have any questions about getting started with the Store Dashboard, call us at (844) FLOWHUB or email help@flowhub.com to set up a time with our support team.
If you’re interested in learning more about how Flowhub point-of-sale software can help your dispensary grow revenue and stay compliant, book a demo.
